4QFY2018 Result Update | Cable
May 21, 2018
KEI Industries
BUY
CMP
`433
Performance Update
Target Price
`508
Y/E March (` cr)
4QFY18
4QFY17
% yoy
3QFY18
% qoq
Investment Period
12 months
Net sales
1,030
739
39
889
16
EBITDA
101
73
39
84
20
Stock Info
Sector
Cable
EBITDA margin (%)
9.8
9.9
(0.05bps)
9.5
0.3
Market Cap (Rs cr)
3,393
Adjusted PAT
50
35
40
39
27
Net Debt
750
Beta
0.6
Source: Company, Angel Research
52 Week High / Low
471/198
Avg. Daily Volume
16,814
For 4QFY2018, KEI Industries (KEI) posted good set of results, exceeding our
Face Value (Rs)
2
expectations on both, top-line as well as bottom-line fronts. Revenues grew by
BSE Sensex
33,812
~39% yoy (above our estimate), however, the company reported flat operating
Nifty
10,442
Reuters Code
KEIN.BO
margins. On the bottom-line front, KEI reported growth of ~40% yoy to `50cr on
Bloomberg Code
KEII.IN
the back of strong top-line growth and lower interest cost.
Top-line driven by strong volume growth: The Company’s top-line grew by ~39%
Shareholding Pattern (%)
Promoters
46.3
yoy to `1,030cr on the back of strong growth in cable prime segment i.e. Cables
MF / Banks / Indian Fls
12.4
and Turnkey Projects. Cable segment grew by ~24.3% yoy during the quarter,
FII / NRIs / OCBs
6.4
whereas Turnkey Projects reported a growth of ~42% yoy. Currently, the company
Indian Public / Others
34.9
has order book of `2,570cr (out which EPC is around `1,425cr and balance from
cables, substation & EHV)
Abs. (%)
3m 1yr 3yr
Sensex
7.4
27.1
22.9
Profitability driven by strong revenue growth and lower interest: On the operating
KEI
16.3
100.5
553.8
front, the company’s margin remained flat on yoy basis at 9.8%. However, KEI
reported ~40% yoy rise in its net profit to `50cr on the back of strong revenue
growth and lower interest cost.
Outlook and Valuation: We expect KEI to report net revenue CAGR of ~16% to
~`4,646cr over FY2018-19E mainly due to (a) higher order book execution in
EPC segment; (b) growth in EHV business; (c) higher B2C sales; and (d) higher
exports. On the bottom-line front, we expect a CAGR of ~19% to `207cr over the
same period on the back strong revenue and lower interest costs. At the CMP of
`433, the stock trades at 16.2x its FY2020E EPS of `26.8. Thus, we maintain our
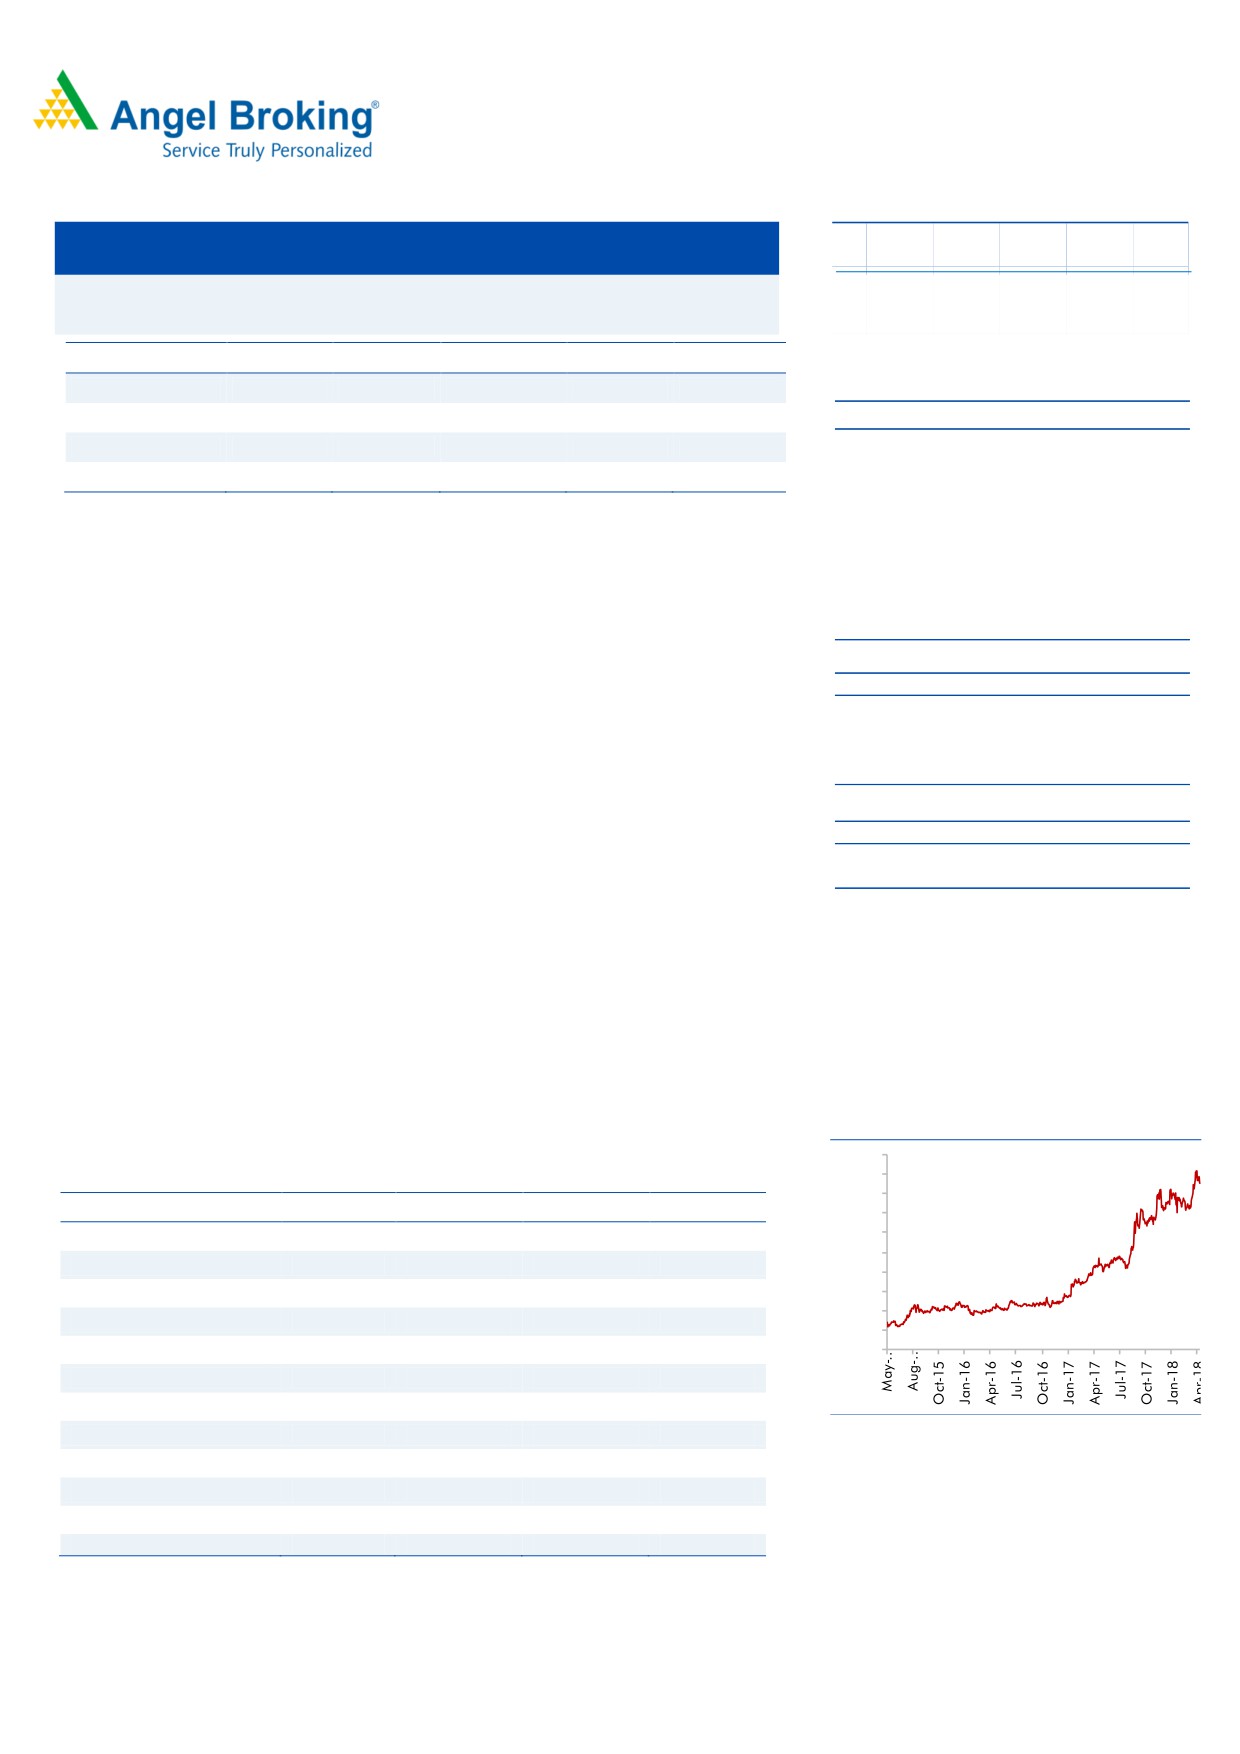
Historical share price chart
Buy rating with the Target Price of `508.
500
450
Key Financials
400
Y/E March (` cr)
FY2017
FY2018
FY2019E
FY2020E
350
300
Net sales
2,628
3,466
4,049
4,646
250
% chg
13.0
31.8
16.8
14.7
200
Adj. Net profit
94
145
174
207
150
100
% chg
50.6
54.6
19.9
19.1
50
EBITDA margin (%)
10.2
9.8
10.0
10.0
-
EPS (`)
12.1
18.7
22.5
26.8
P/E (x)
35.7
23.1
19.3
16.2
P/BV (x)
7.1
5.5
4.4
3.5
Source: Company, Angel Research
RoE (%)
19.8
23.8
22.6
21.6
Amarjeet S Maurya
RoCE (%)
20.3
22.6
24.4
24.9
022-40003600 Ext: 6831
EV/Sales (x)
1.5
1.2
1.0
0.8
EV/EBITDA (x)
14.9
11.8
9.8
8.5
Source: Company, Angel Research Note
Please refer to important disclosures at the end of this report
1
KEI Industries| 4QFY2018 Result Update
Exhibit 1: 4QFY2018 Performance
Y/E March (` cr)
4QFY18
4QFY17
% yoy
3QFY18
% qoq
FY2018
FY2017
% chg
Net Sales
1,030
739
39.4
889
16.0
3,466
2,628
31.8
Consumption of RM
715.7
539
32.8
621
15.2
2,411
1,828
31.9
(% of Sales)
69.5
72.9
69.9
69.6
69.5
Staff Costs
41
32
28.7
37
10.7
147
112
31.4
(% of Sales)
4.0
4.3
4.2
4.2
4.3
Other Expenses
173
95
81.1
146
18.2
568
420
35.2
(% of Sales)
16.8
12.9
16.5
16.4
16.0
Total Expenditure
929
666
39.5
804
15.5
3,126
2,360
32.5
Operating Profit
101
73
38.7
84
19.9
339
269
26.2
OPM
9.8
9.9
9.5
9.8
10.2
Interest
28.8
30.2
(4.4)
25.1
14.6
112
124
(10.1)
Depreciation
8.0
7.8
3.0
8.2
(2.8)
32
28
13.5
Other Income
(1)
7
7
9
10
PBT (excl. Ext Items)
64
42
52.1
58
9.2
204
126
62.2
Ext (Income)/Expense
PBT (incl. Ext Items)
64
42
52.1
58
9.2
204
126
62.2
(% of Sales)
6.2
5.7
6.6
5.9
4.8
Provision for Taxation
14
7
19
60
32
(% of PBT)
22.1
15.6
33.0
29.2
25.7
Reported PAT
50
35
40.4
39
27.0
145
94
54.6
PATM
4.8
4.8
4.4
4.2
3.6
Minority Interest After NP
Extra-ordinary Items
Reported PAT
50
35
40.4
39.02
27.0
144.8
93.6
54.6
Source: Company, Angel Research
May 21, 2018
2
KEI Industries| 4QFY2018 Result Update
Outlook and Valuation
We expect KEI to report net revenue CAGR of ~16% to ~`4,646cr over FY2018-
19E mainly due to (a) higher order book execution in EPC segment; (b) growth in
EHV business; (c) higher B2C sales; and (d) higher exports. On the bottom-line
front, we expect a CAGR of ~19% to `207cr over the same period on the back
strong revenue and lower interest costs. At the CMP of `433, the stock trades at
16.2x its FY2020E EPS of `26.8. Thus, we maintain our Buy rating with the Target
Price of `508.
Downside risks to our estimates
KEI’s EPC segment contributes ~14% in the total revenue. This segment
primarily depends upon government spending and any delay in investment
by the government may lead to reduction in order book and would impact its
revenue.
Any unfavorable change in the prices of commodities, forex and interest
rates, and delay in project execution can hurt its profitability.
Company Background
KEI Industries Limited (KEI) is a cable manufacturing company, engaged in
manufacture and supply of power and other industrial cables. The company is also
engaged in Engineering, Procurement and Construction (EPC) business. It operates
through Cables and Turnkey Projects segments and has its manufacturing facilities
at Bhiwadi & Chopanki in Rajastahn and Silvassa in Dadra and Nagar Haveli.
The cables segment comprises of a whole range of cables such as Extra High
Voltage (EHV), High tension (HT) and low tension (LT) power cables, control and
instrumentation cables, winding wires, flexible wires, and house and stainless steel
wires. Their products are supplied to various sectors like oil refineries, railways,
automobiles, cement, steel, fertilizers, textile and real estate sectors.
May 21, 2018
3
KEI Industries| 4QFY2018 Result Update
Profit & Loss Statement
Y/E March (`cr)
FY2017
FY2018
FY2019E
FY2020E
Total operating income
2,628
3,466
4,049
4,646
% chg
13.0
31.8
16.8
14.7
Total Expenditure
2,360
3,126
3,644
4,181
Raw Material
1,828
2,411
2,859
3,280
Personnel
112
147
170
195
Others Expenses
420
568
615
706
EBITDA
269
339
405
465
% chg
11.0
26.2
19.4
14.7
(% of Net Sales)
10.2
9.8
10.0
10.0
Depreciation& Amortisation
28
32
35
40
EBIT
240
307
370
425
% chg
10.8
27.7
20.4
15.0
(% of Net Sales)
9.1
8.9
9.1
9.1
Interest & other Charges
124
112
121
127
Other Income
10
9
10
10
(% of PBT)
8.0
4.5
3.9
3.2
Share in profit of Associates
-
-
-
-
Recurring PBT
126
204
259
309
% chg
32.2
62.2
26.7
19.1
Tax
32
60
86
102
(% of PBT)
25.7
29.2
33.0
33.0
PAT (reported)
94
145
174
207
Extraordinary Items
-
-
-
-
ADJ. PAT
94
145
174
207
% chg
50.6
54.6
19.9
19.1
(% of Net Sales)
3.6
4.2
4.3
4.4
Basic EPS (Rs)
12.1
18.7
22.5
26.8
Fully Diluted EPS (`)
12.1
18.7
22.5
26.8
% chg
50.6
54.6
19.9
19.1
May 21, 2018
4
KEI Industries| 4QFY2018 Result Update
Balance Sheet
Y/E March (`cr)
FY2017
FY2018
FY2019E
FY2020E
SOURCES OF FUNDS
Equity Share Capital
16
16
16
16
Reserves& Surplus
458
593
752
942
Shareholders Funds
473
608
768
958
Minority Interest
-
-
-
-
Total Loans
713
750
750
750
Deferred Tax Liability
46
46
46
46
Total Liabilities
1,233
1,404
1,564
1,755
APPLICATION OF FUNDS
Gross Block
604
624
654
685
Less: Acc. Depreciation
199
231
266
306
Net Block
405
393
388
380
Capital Work-in-Progress
3
3
3
3
Investments
3
3
3
4
Current Assets
1,399
1,830
2,158
2,514
Inventories
499
665
777
891
Sundry Debtors
739
883
1,032
1,184
Cash
37
76
107
160
Loans & Advances
119
173
202
232
Other Assets
5
34
40
46
Current liabilities
582
829
992
1,149
Net Current Assets
818
1,001
1,166
1,365
Deferred Tax Asset
3
3
3
3
Mis. Exp. not written off
-
-
-
-
Total Assets
1,233
1,404
1,564
1,755
May 21, 2018
5
KEI Industries| 4QFY2018 Result Update
Consolidated Cashflow Statement
Y/E March (`cr)
FY2017
FY2018
FY2019E FY2020E
Profit before tax
134
204
259
309
Depreciation
34
32
35
40
Change in Working Capital
(259)
(145)
(134)
(145)
Interest / Dividend (Net)
123
112
121
127
Direct taxes paid
(30)
(60)
(86)
(102)
Others
3
0
0
0
Cash Flow from Operations
4
144
196
227
(Inc.)/ Dec. in Fixed Assets
1
(20)
(30)
(31)
(Inc.)/ Dec. in Investments
(62)
0
0
0
Cash Flow from Investing
(62)
(20)
(30)
(31)
Issue of Equity
0
0
0
0
Inc./(Dec.) in loans
251
37
0
0
Dividend Paid (Incl. Tax)
(4)
(10)
(14)
(17)
Interest / Dividend (Net)
(158)
(112)
(121)
(127)
Cash Flow from Financing
89
(85)
(135)
(143)
Inc./(Dec.) in Cash
31
39
31
53
Opening Cash balances
6
37
76
107
Closing Cash balances
37
76
107
160
May 21, 2018
6
KEI Industries| 4QFY2018 Result Update
Key Ratios
Y/E March
FY2017
FY2018
FY2019E
FY2020E
Valuation Ratio (x)
P/E (on FDEPS)
35.7
23.1
19.3
16.2
P/CEPS
27.4
18.9
16.0
13.6
P/BV
7.1
5.5
4.4
3.5
Dividend yield (%)
0.2
0.3
0.4
0.5
EV/Sales
1.5
1.2
1.0
0.8
EV/EBITDA
14.9
11.8
9.8
8.5
EV / Total Assets
3.3
2.9
2.5
2.2
Per Share Data (`)
EPS (Basic)
12.1
18.7
22.5
26.8
EPS (fully diluted)
12.1
18.7
22.5
26.8
Cash EPS
15.8
22.9
27.0
31.9
DPS
0.7
1.3
1.8
2.1
Book Value
61.3
78.7
99.4
124.0
Returns (%)
ROCE
20.3
22.6
24.4
24.9
Angel ROIC (Pre-tax)
21.0
24.0
26.3
27.5
ROE
19.8
23.8
22.6
21.6
Turnover ratios (x)
Asset Turnover (Gross Block)
4.3
5.6
6.2
6.8
Inventory / Sales (days)
69
70
70
70
Receivables (days)
103
93
93
93
Payables (days)
42
40
41
42
Working capital cycle (ex-cash) (days)
130
123
122
121
May 21, 2018
7
KEI Industries| 4QFY2018 Result Update
Research Team Tel: 022 - 39357800
DISCLAIMER
This document is solely for the personal information of the recipient, and must not be singularly used as the basis of any investment
decision. Nothing in this document should be construed as investment or financial advice. Each recipient of this document should
make such investigations as they deem necessary to arrive at an independent evaluation of an investment in the securities of the
companies referred to in this document (including the merits and risks involved), and should consult their own advisors to determine
the merits and risks of such an investment.
Angel Broking Pvt. Limited, its affiliates, directors, its proprietary trading and investment businesses may, from time to time, make
investment decisions that are inconsistent with or contradictory to the recommendations expressed herein. The views contained in this
document are those of the analyst, and the company may or may not subscribe to all the views expressed within.
Reports based on technical and derivative analysis center on studying charts of a stock's price movement, outstanding positions and
trading volume, as opposed to focusing on a company's fundamentals and, as such, may not match with a report on a company's
fundamentals.
The information in this document has been printed on the basis of publicly available information, internal data and other reliable
sources believed to be true, but we do not represent that it is accurate or complete and it should not be relied on as such, as this
document is for general guidance only. Angel Broking Pvt. Limited or any of its affiliates/ group companies shall not be in any way
responsible for any loss or damage that may arise to any person from any inadvertent error in the information contained in this report.
Angel Broking Pvt. Limited has not independently verified all the information contained within this document. Accordingly, we cannot
testify, nor make any representation or warranty, express or implied, to the accuracy, contents or data contained within this document.
While Angel Broking Pvt. Limited endeavours to update on a reasonable basis the information discussed in this material, there may be
regulatory, compliance, or other reasons that prevent us from doing so.
This document is being supplied to you solely for your information, and its contents, information or data may not be reproduced,
redistributed or passed on, directly or indirectly.
Angel Broking Pvt. Limited and its affiliates may seek to provide or have engaged in providing corporate finance, investment banking
or other advisory services in a merger or specific transaction to the companies referred to in this report, as on the date of this report or
in the past.
Neither Angel Broking Pvt. Limited, nor its directors, employees or affiliates shall be liable for any loss or damage that may arise from
or in connection with the use of this information.
Note: Please refer to the important `Stock Holding Disclosure' report on the Angel website (Research Section). Also, please refer to the
latest update on respective stocks for the disclosure status in respect of those stocks. Angel Broking Pvt. Limited and its affiliates may
have investment positions in the stocks recommended in this report.
Disclosure of Interest Statement
KEI Industries
1. Analyst ownership of the stock
No
2. Angel and its Group companies ownership of the stock
No
3. Angel and its Group companies' Directors ownership of the stock
No
4. Broking relationship with company covered
No
Note: We have not considered any Exposure below ` 1 lakh for Angel, its Group companies and Directors
Ratings (Returns):
Buy (> 15%)
Accumulate (5% to 15%)
Neutral (-5 to 5%)
Reduce (-5% to -15%)
Sell (< -15%)
May 21, 2018
8